Astroweather
Motivation
For the last few years (as of writing this in 2022), I’ve been fascinated by astronomy. I really like astrophotography, which means taking pictures of different astronomical objects, such as the Moon, different galaxies and beautiful nebulae. In order to see the night sky well, there can not be much cloud coverage or light pollution.
I don’t know any service where I could easily see both weather and light pollution, so the only reasonable thing to do was to make it myself. I wanted it to have all the necessary information in one simple dashboard, so I could quickly check it and see if tonight is suitable for photographing the universe.
Technical implementation
Frontend
The frontend is created with React.js 17. This was the first “large scale project” (if you can call it that) that I have done with Mantine, a newcomer to the UI component scene. I really enjoyed working with Mantine, and I will definitely use it in projects later too.
In the design of Astroweather, I tried to mimic glassmorphism. I don’t think I succeeded in it that well, because I left out a lot of the details. The back panel is basically a transparent div that has a bit of blur (except on Firefox…).
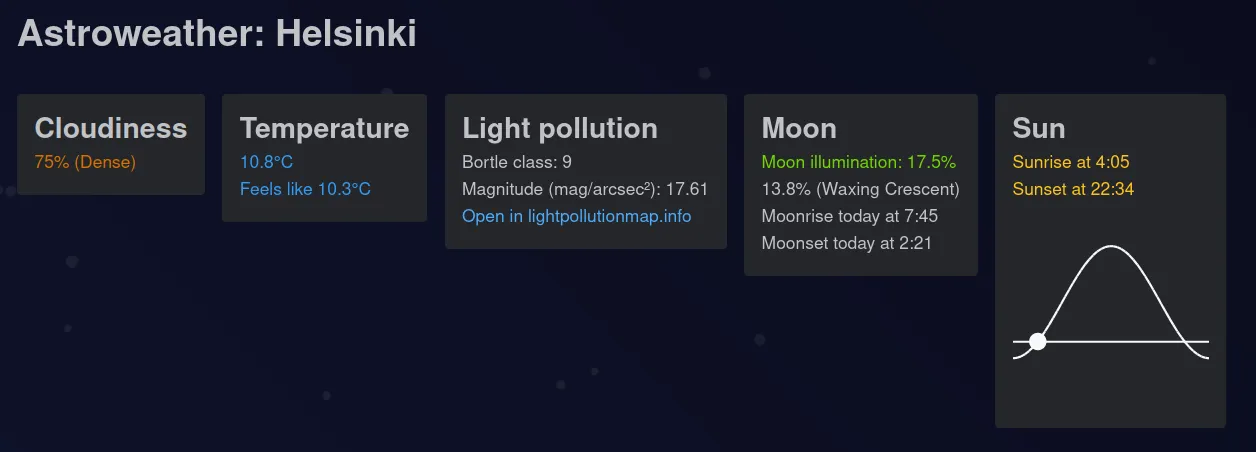
The interface is divided into these kind of cards. Currently there are 5 different cards (cloudiness, temperature, light pollution, moon and sun). The four first cards are very simple to implement; they just show a few lines of text with a bit of color to show the scale. The last card, sun, was more difficult however. The sun card has a diagram which shows the sun’s position in the sky. The straight horizontal line represents the horizon: when the dot is above it, the sun is visible. The curved line shows the sun’ approximate position in the sky during the whole day. I had to calculate the intersection points (sunrise and sunset) and align the horizontal line to that. The sun’s position is roughly a sine wave, so I used that to draw the line. The whole diagram is implemented with scalable vector graphics (SVG), and abstracted into a generic component that can plot any function.
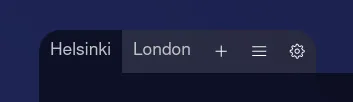
The most satisfying thing to implement was definitely the tabs on top of the panel. To be honest, creating the tabs was not very difficult, but I really like the way it came out in the end. It brings a bit of depth to the otherwise boring panel. The rounded corners make it look polished. The one thing I learned while making the tabs were the :first-child and :last-child CSS selectors. They make it very easy to round the corners on the first and last tabs.
Libraries used for frontend
- Mantine as the UI component library
- Radix Icons for all the different icons
- Axios for making HTTP requests to the backend
- date-fns for formatting dates and assisting in calculating sunset and sunrise times
- Mapbox for creating the interactive world maps
- React DnD for implementing reorderable lists
- tsParticles for drawing the floating particles in the background
- SunCalc for calculating sunset and sunrise times
Backend
The backend for Astroweather is mostly implemented in Node.js and Express. The Light Pollution API is implemented in Python for reasons I will explain later. The backend is very simple, it basically only proxies requests to the OpenWeatherMap API and returns the response. I implemented caching to reduce the number of requests to the API. There’s really not much more to it.
Light Pollution API
The Light Pollution API was the hardest part of this whole project. As far as I know, there doesn’t exist an API for getting the light pollution levels for a specific location. This meant that I had to source the data and turn it into a queryable format. I already knew about a light pollution map, https://www.lightpollutionmap.info. Now I returned to it to try and figure out where they get the data from. I noticed that lightpollutionmap.info cited a 2016 study about light pollution, so I used that as a reference too (Falchi, Fabio; Cinzano, Pierantonio; Duriscoe, Dan; Kyba, Christopher C. M.; Elvidge, Christopher D.; Baugh, Kimberly; Portnov, Boris; Rybnikova, Nataliya A.; Furgoni, Riccardo (2016): Supplement to: The New World Atlas of Artificial Night Sky Brightness. V. 1.1. GFZ Data Services. https://doi.org/10.5880/GFZ.1.4.2016.001).
I downloaded the light pollution maps and quickly noticed that they were enormous. A zip that contained all maps was over 650 MB, and when unzipped it was almost 3.5 GB. The file that I needed was around 3.0 GB.
My plan was to read single pixels from the 3 GB file. I started by searching for an npm package for reading pixels from a file. I found one, but starting the server took over 40 seconds. The library was trying to read the whole 3 GB file into memory, which would obviously take a lot of time.
I then searched for a library that could read pixels without loading the whole file into memory. I assumed that npm would have an answer, but after trying a dozen different libraries, none of them worked fast enough. Now I realized, that I may have to switch away from JavaScript and try something else. I chose Python, because I was already familiar with it and it was simple enough.
After trying a few different libraries, none of them working, I found pyvips. There was one small problem though; I couldn’t install it for some reason. The library had instructions for installing it on Windows, but I just couldn’t get it to work. I ended up installing WSL on my Windows machine, and then running the Light Pollution API on that. I probably could have just used a Docker container to run it, which would’ve been a much better solution.
Libraries and tools used for backend
- NGINX to combine the main API and the Light Pollution API
Main API
- Express for the backend server
- Axios for getting the weather data from OpenWeatherMap API
- node-cache for caching the weather data from OpenWeatherMap
Light Pollution API
- gunicorn for the backend server
- Flask for backend framework
- pyvips for sampling pixels from the light pollution map
Lessons learned
Reordering lists
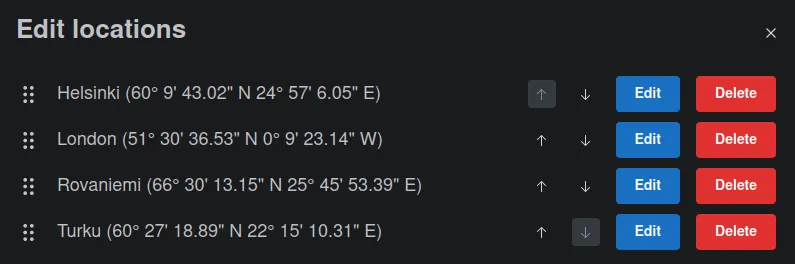
The user is able to edit, remove and reorder the location list. Reordering can be done either by dragging or by clicking on the arrow buttons. I used the React DnD library to implement the drag and drop functionality. I hadn’t used it before at all, but luckily it was easy to get started. At the time I didn’t know about Framer’s Reorder component. I probably would have used that because of its simplicity, but I didn’t know about it. It was a good learning experience making the list from scratch, though.
Linux
When I started writing the project, I was using Windows 11. Installing pyvips on Windows was too difficult, so I had to resort to WSL. That was one of the final pushes which made me switch to Linux fully. Currently I use Linux Mint as my main operating system, but I still have Windows 11 installed by dual-booting. So creating this project made me indirectly learn Linux. I only know the basics as of right now, but I’m comfortble navigating the terminal and using the most common commands.